How much does a kilometre in your car cost
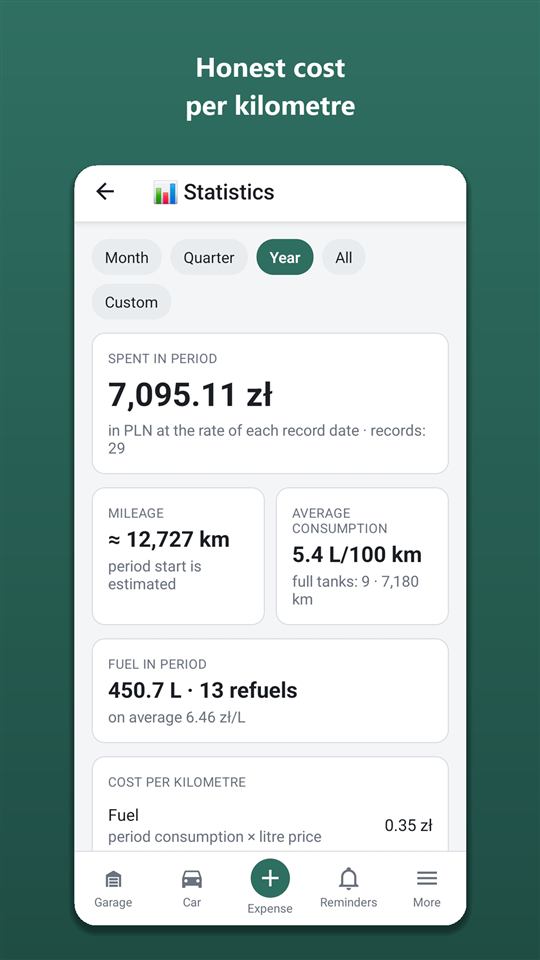
Autoracle’s statistics show not just the sum of your receipts but the cost per kilometre: driving (fuel and maintenance) separately from owning the car as a whole (plus insurance, tax, tolls). Average fuel consumption is calculated honestly — only between two full-tank fill-ups.
- The cost per kilometre is split into “driving” (fuel, workshop, parts, DIY maintenance) and “ownership” (plus documents and insurance, tax, tolls and parking, loan interest).
- Fines are never included in the cost per kilometre; neither are upgrades and tuning.
- Average consumption is calculated only over intervals where both fill-ups were to a full tank; with no such pairs, an estimate marked “≈” is shown.
- Spending in different currencies is converted into the car’s currency at the rate on the date of each record.
- Consumption in different weather (five temperature bands, separately for each tyre set) and by petrol grade appears once a group has at least 300 km.
- Statistics, the consumption chart, CO₂ and the year in review are free; comparing the cars in your garage and showing amounts without VAT are in Orik Pro.
How the cost per kilometre is calculated
In Autoracle the cost per kilometre is two figures: driving (what it costs to drive a kilometre) and ownership (what it costs to have the car, per kilometre). Both are in the car’s currency.
- Driving = fuel per kilometre + running rate. Fuel is the period’s average consumption × the period’s average price per litre. The running rate is all workshop, parts and DIY maintenance spending over the whole time you’ve owned the car, divided by the kilometres driven in that time.
- Ownership = driving + documents and insurance, tax, tolls and parking over the whole ownership per kilometre of ownership, plus the interest on a loan or leasing.
- Kilometres of ownership — from the mileage at purchase (a field in the car details) to the latest odometer reading. If the mileage at purchase isn’t set — from the first reading in the app.
- Cost for the period = rate × distance driven in the period.
Why maintenance is taken over the whole ownership and not per month: repairs are rare, so in the month you replace the clutch a kilometre would “cost” many times more, and in the next almost nothing. An average rate over the whole time is closer to reality.

I never count fines in the cost per kilometre — that’s an incident, not the price of driving. You can see them separately.
Step by step in the help guide
What isn’t included in the cost per kilometre
Fines, upgrades and the loan principal aren’t included in the cost per kilometre — this spending shows in your expenses but doesn’t distort the cost of driving.
- Fines — always excluded.
- Upgrades and tuning (wheels, multimedia, sound deadening, chip tuning) — the “Upgrade” mark on a record; statistics show a separate “Upgrades in this period” line.
- Loans and instalments — only the interest counts towards ownership: the loan principal is the price of the car. For a subscription, or leasing without a contract amount — the whole payment.
- No depreciation — the loss of the car’s value isn’t counted anywhere.
- Amounts without an exchange rate (no connection, or the rate provider doesn’t have the currency) are shown separately and aren’t included in the rate.
How average fuel consumption is calculated
Average consumption is calculated only between two full-tank fill-ups: all the litres put in between them are divided by the kilometres between them. Partial fill-ups inside the interval count towards the litres, and an interval with a missed record isn’t counted.
Example: on 2 March you filled up to full at 84,210 km, on 9 March topped up 20 l, on 16 March filled to full again — 31 l at 84,890 km. The interval’s consumption is (20 + 31) l over 680 km ≈ 7.5 l/100 km.
- For a period the intervals that ended in that period are used; several intervals are averaged by distance (all litres / all km).
- The “≈” sign. If there are no full-tank pairs at all yet, Orik shows an estimate: the litres of all fill-ups except the last, over the kilometres from the first to the last (at least 100 km). A note tells you that consumption will become exact after two full-tank fill-ups.
- Electric car — in kWh/100 km; if you enter the charge percentage before and after, consumption is calculated from the battery capacity, allowing for charging losses.
- Two fuel systems — consumption for each tank separately.
- Estimated mileage (with “≈”) isn’t used for consumption: such a fill-up never ends an interval.
Below is a consumption chart by fill-up: the last 20 intervals, the average line, and intervals deviating by more than 25% (at 50 km or longer) highlighted — so you can spot a mistake in a record or an unusual trip.
How much the car uses in frost and in heat, on winter and summer tyres
Under the consumption chart Autoracle sorts every interval between full-tank fill-ups by the average temperature of those days in the car’s region — five bands: frost (below −10°), cold (−10…+5°), cool (+5…+15°), warm (+15…+25°) and hot (above +25°) — and separately by the tyre set that was on the car at the time. The weather comes from the archive for the region set in car details. A band appears once it has at least 300 km.
- Weather — how many percent higher consumption is in the cold or the heat than in the most economical weather. You can see what warm-ups, the heater and the air conditioning cost you.
- Tyres — with two sets, they are compared in the same weather, adjusted for temperature, so winter tyres don’t get blamed for the cold.
- Petrol grade (92, 95, 98, 100) — by the full-tank fill-up at the start of the interval. If you topped up with another grade, the tank counts as mixed and isn’t included.
- “Cheaper” — whichever makes 100 km cheaper: consumption × price per litre. This shows whether 98 pays for itself with lower consumption.
Fuel station brands. The “Orik noticed” card on the dashboard shows an observation if you pay noticeably more or less at one brand than at your others: it compares the price paid (with discounts) for the same fuel and grade within ±30 days — from 3 fill-ups at the brand and a difference of at least 3%.
I compare only your own fill-ups — no national averages from other people.
What it costs to keep the car and how much more will go out before the year ends
Autoracle splits spending into two parts: what goes out every month even if the car just sits, and what each kilometre adds. That shows what the car costs at your mileage and how much of it is fixed payments.
- Fixed — current insurance, inspection and registration (the amount spread over the months the document is valid), tax, rented space, loan and lease payments in full. Documents with no expiry and one-time taxes are not included — they are counted once, in expenses and cost per km.
- Variable — fuel, workshop, parts, care, tolls and one-off parking over the last 12 months, per kilometre.
- Still to come this year — a forecast until 31 December based on past amounts: document renewals, tax, scheduled payments, rented space, the next scheduled service, tyre storage and fuel at your 3-month average. Sudden repairs aren’t included.
- Repairs year on year — workshop and DIY spending over 12 months against the year before, by car system. It appears once your records cover two years: if repairs keep growing year after year, it may be time to think about replacing the car.
I count only your own records — fines, upgrades and station-shop purchases aren’t included here.
Where the money goes: categories, months, mileage
The “Statistics” screen opens when you tap the “Spending for the period” card on the dashboard and shows the same period: month, quarter, year, all time or your own dates.
- Spending for the period — in the car’s currency at the rate on the date of each record.
- By category — a share bar and a list sorted by amount with percentages; tapping a category opens its records for the period.
- By month — bars for 12 months; a tap shows the amount.
- Distance for the period — from odometer readings. If there were no readings for a long time before the period started, the mileage at the start is estimated in a straight line and shown with “≈”.
- Fuel for the period — litres, number of fill-ups, average price, saved with discounts; for an EV — the price per kWh on slow and fast charging separately.
- Income and profit from work — if you log income (see for business and taxi).
Records from the queue (logged offline) are counted straight away. All spending can be exported to Excel — more on the expense tracking page.
How to calculate your car’s CO₂ emissions
CO₂ emissions are calculated from the fuel you put in and shown under “Fuel for the period” and in the year in review.
- Petrol — 2.31 kg of CO₂ per litre, diesel — 2.68, LPG — 1.51; CNG — 2.75 kg per kg (1.97 per m³).
- Electric car — from the power-station emissions of the country of the car’s region (European Environment Agency data for 2023); outside the EU — the EU average.
Your car’s year in review
The “Year in review” button in statistics puts the year on one screen: spending and the difference from last year, distance, what each kilometre cost, consumption, workshop visits, the top 3 categories and the biggest expense (other than fuel). The year in review is free.
“Each kilometre” in the year in review is calculated carefully: fuel from average consumption and average price (even if not all of the year’s fill-ups were logged), plus the year’s other spending over the year’s distance, without fines and upgrades.
You can share the year in review as text, and on the phone as a picture card with Orik and his line about your year.
How to compare the running costs of two cars
If you have two or more cars in the garage, the “Compare cars” button shows them side by side in one currency: cost per kilometre (driving and ownership), spending and distance over 12 months, average consumption, maintenance per kilometre. The most economical one is highlighted in green.
Comparison is an Orik Pro feature (free in countries where AI is unavailable). It’s handy for a family with two cars and for anyone deciding which car to use for work.
For cars tracked with VAT, the “Show VAT” tick box (Pro) shows the cost per kilometre without recoverable VAT — more on VAT for business.
Frequently asked questions: How much does a kilometre in your car cost
Are the statistics free?
Yes: spending, categories, months, cost per kilometre, average consumption, the chart, consumption in different weather, CO₂, the year in review, “What it costs to keep the car”, the forecast to year end and repairs year on year are free forever. Comparing cars and showing amounts without VAT are in Orik Pro.
Why isn’t average consumption shown after the first fill-up?
Consumption is calculated only between two full-tank fill-ups. Until then, Orik can show an estimate marked “≈” once there are enough fill-ups with mileage.
Are fines included in the cost per kilometre?
No, never. Fines show in your expenses and in the category statistics, but they don’t inflate the cost of driving.
Is a car loan taken into account?
Only the interest on a loan or instalment plan counts towards ownership — the loan principal is treated as the price of the car. Spending by category shows the full payments.
What does the “≈” sign mean?
It’s an estimate: for example, the mileage at the start of the period was worked out in a straight line between readings, or consumption was estimated from receipts without a pair of full-tank fill-ups.
Do the statistics work offline?
Yes, the screen shows the last loaded version, and records logged offline are counted straight away.
Car expense tracker: fuel, repairs and insurance — in any currency
Autoracle keeps every car expense in one place — from a refuel to a fine or a loan payment.
Learn moreRoad trip cost calculator for driving in Europe
The Autoracle calculator plans the route by road, sees which countries it crosses and works out fuel at each country’s price, toll roads, vignettes and ferries.
Learn moreA car for work: taxi, delivery, business and VAT
If your car earns money, you need to know not just the costs but the profit from every kilometre.
Learn moreTry it with your own car
All tracking is free forever. Photo recognition and Orik the assistant — 3 days of Pro free after sign-up.